Category Archives: Economy

Consumer Spending is Beginning to Falter

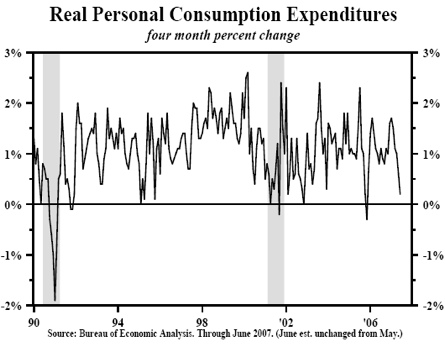
Excluding the decline in consumer spending during the second half of ‘05 due to hurricane Katrina, consumption has been the weakest since 2002. As depicted by the following graph, real personal consumer expenditures (PCE) has been nearly flat over the last four months:

Real PCE till Q2 2007

I believe that consumer spending would come under pressure as soon as the housing bubble popped. Despite plummeting home sales and stagnating home prices during most of last year, consumer spending did not immediately suffer. Why? I have three explanations:

  1. There is a lag of several months between when businesses begin to struggle and when they actually layoff workers. So the hundreds of thousands of construction, lending and realtor jobs created during the housing boom are only beginning to be reduced. Non-farm household employment, an alternative jobs measure that historically has been more accurate at cyclical turning points, expanded 45,000 per month this year compared to a 235,000 average monthly gain in 2006, an 80% decline.
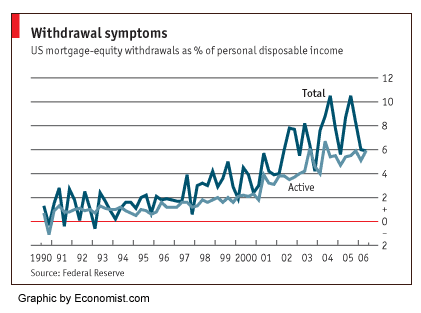
  2. Mortgage equity withdrawals (MEW) represented over 5% of personal disposable income until this year. With tighter lending standards, higher interest rates, and falling home prices you can bet that MEW will fall even further.
  3. Real personal disposable income grew by 2.6% last year after rising by only 1.2% in 2005. For the first 5 months of this year, real disposable income has increased by only 0.5%.

Add to all this the rise in food prices, gasoline prices, and interest rates, and the sluggish PCE and sales that retailers have been reporting lately may be the beginning of a more protracted downturn in consumer spending, which represented about 68% of US economic activity during the first quarter. My forecast of a 2007 recession still looks possible.

The Birth/Death Ratio’s Impact on the Jobs Data

I no longer pay much attention to the BLS monthly employment reports because it later is often significantly revised by which time the report is useless as a forecasting tool. John Mauldin explains how the BLS is currently overstating employment numbers:

To start with, let’s dissect the employment numbers. The official headline number for June was 132,000 new jobs. Since we need about 150,000 new jobs just to stay even with population growth, that is hardly a robust number, but not too far off from what would be a good number. Except that there are some problems with the headline number.

The employment numbers come from a survey of established businesses. But obviously the Bureau of Labor Statistics (BLS) cannot call every business in the US, so they simply survey the larger businesses. But that means they miss the growth in the small-business sector of the economy, which is where the largest amount of new jobs are created.

The BLS surveys about 160,000 businesses in its sample model. There is an unavoidable lag between an establishment opening for business and its appearing on the sample frame and being available for sampling. Because new firm “births” generate a significant portion of employment growth each month, non-sampling methods must be used to estimate this growth. To make up for this, they add or subtract a certain number of jobs, called the birth/death (of new businesses) ratio.

They use the actual births and deaths of real businesses for the last five years to make their estimates of new jobs created from new business. This is quite a legitimate methodology, but it does have one problem. It is backward-looking data. BLS knows that and states the following on its web site:

“The most significant potential drawback to this or any model-based approach is that time series modeling assumes a predictable continuation of historical patterns and relationships and therefore is likely to have some difficulty producing reliable estimates at economic turning points or during periods when there are sudden changes in trend. BLS will continue researching alternative model-based techniques for the net birth/death component; it is likely to remain as the most problematic part of the estimation process.”

Remember the jobless recovery of the first Bush term and the constant criticism about the poor economy? Why was the economy doing so well and yet job creation was so poor? It turns out that a great deal of the explanation is that the BLS underestimated the number of new jobs being created by small business. In the early years of the recovery, rather badly.

Likewise, the BLS data will overestimate jobs when the economy is slowing down. Is there some evidence that may be the case today? I think there is.

To the credit of the BLS, they are very transparent about their data. There are massive amounts of data available at www.bls.gov and the data on the birth/death ratio is at http://www.bls.gov/web/cesbd.htm. Now, let’s examine the contribution of the birth/death ratio to the employment numbers.

Last month, the BLS estimated that there were 156,000 new jobs in the birth/death ratio category, which was 24,000 more jobs than they estimated were created for the month. OK, maybe no problem. Looking back over five years, the economy has created about that many new jobs during the month.

Except that they estimated 26,000 new small-business construction jobs. With home construction dropping, do we really think that the same number of new jobs was created in construction as in June of 2006 and 2005? Or that 153,000 new jobs in small-business construction have been created this year? Really?

In fact, since January, the BLS estimates for the birth/death ratio have added 747,000 new jobs of a total projected growth of 871,000 jobs, or 86% of the total of the jobs estimated supposedly created for the first half of the year.

Is there any other reason to believe that the birth/death ratio may be overstating employment as the economy slows? The always astute Paul Kasriel of Northern Trust thinks there is. He notes that in 2005 the contribution of the birth/death ratio (12-month average) to the overall employment numbers was well under 35%. Today it is over 56%. Given the recent numbers, that ratio is likely to rise.

“What has been happening to the relative contribution of birth/death estimates as the economy has slowed in the past year? The chart below shows that it has been rising. In the 12 months ended March 2006, the birth/death adjustment was contributing only 30.9% of the jobs to the change in nonfarm payrolls. The birth/death relative contribution has been trending higher since then. Notice that as the birth/death contribution to nonfarm payrolls has been trending higher, the percentage of small businesses saying that now is a good time to expand their operations has been trending lower. If existing small business managers do not think now is a good time to expand their operations, does it make sense that there are a lot of new small businesses starting up and hiring?

“Perhaps because the birth/death adjustment is not, itself, adjusted for the phase of the business cycle the economy is in, it is biasing upward the growth in nonfarm payrolls now. Perhaps the birth/death adjustment is the answer to the Fed’s latest conundrum with regard to stronger-than-expected payroll growth given the sharp slowing in real GDP growth.”

The number of unemployed rose by 114,000 in June, as both the labor force and population rose. That does not sound robust to me. That seems to call into doubt the recent numbers.

I have another reason for doubting the jobs data. If employment growth is decent, than why are real wages falling this year?
Jobs Data: Monthly vs. Quarterly Surveys

The Bureau of Labor Statistics’ monthly survey of employers is a popular report that investors use to gauge the strength of the labor market. However, the numbers can be way off from reality.

For instance, the bureau releases a quarterly report, titled “Business Employment Dynamics” that comes from state unemployment records. The latest report was released for the 3rd quarter of last year and showed that only a net 19,000 private sector jobs were added to the economy.

On the other hand, the widely reported monthly survey concluded that private-sector employment grew by 498,000 jobs — a healthy number considering the economy grew by only 2% during that period.

A big difference was in construction employment where the monthly survey determined that 34,000 net-jobs were added compared to a loss of 77,000 jobs in the quarterly study.

What’s causing the significant discrepancy? One reason may be that the bureau uses a “birth/death” model to estimate the change in employment from the launching and demise of businesses. Eventually, the monthly numbers will be revised to reflect the results of the quarterly survey, but that won’t be done until data is available for the 4th of last year and the 1st quarter of this one.

I tend to ignore the monthly jobs data because it is often subject to large revisions much later on, at which point the numbers are useless as a forecasting tool since employment is a coincident indicator of economic growth.

The Subprime Market Implosion and its Consequences

The subprime mortgage market has been dominating news lately with signs that rising defaults and delinquencies are wreaking havoc on the mortgage industry. Here are some of the headlines:

  • Accredited Home Lenders Holding Co. reported a $37.8 million loss for the 4th quarter — three times wider than analysts expected.
  • ResMae Mortgage Corp. became at least the 20th subprime lender to close or be sold when it filed for bankruptcy.
  • Freemont General Corp., a major lender to people with weak credit histories, announced that it has stopped providing “piggyback” mortgages.
  • HSBC added $1.76 billion to its bad-loan costs for 2006 to cover ailing mortgages.

At the start of this year a general consensus has formed that housing is bottoming. This was based on 4th quarter statistics that suggested inventory, sales and starts were stabilizing. On Friday, Alan Greenspan gave an upbeat assessment on housing during a speech here in Toronto and made the following comments:

The worst of the adjustment is over, meaning not that the market is turning, but that the rate of decline was at its maximum in the third quarter and continued over in the fourth quarter and should now be moving to a much less negative direction.

Regarding sub-prime mortgages:

We do have a problem here, it’s probably not over. It may actually infect some parts of the prime mortgage market, but there’s no real evidence that this is a significant issue.

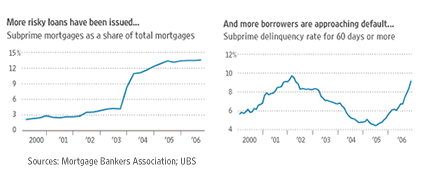
I have a different opinion than the ‘Maestro’. I believe that the subprime market implosion will lead to another leg down for housing activity. To see why, consider that a decade ago subprime mortgages totaled a mere 2% of the entire mortgage market. Today they are one-sixth of all mortgages.

subprime_mortgages

The percentage of subprime delinquencies are at the highest level since 2002. Keep in mind that the subprime mortgage market is now four times bigger than it was then. And the delinquency rate is likely to head much higher.

About 80% of subprime mortgages today are adjustable-rate mortgages that have been nicknamed “exploding ARMs” because they have low fixed-interest payments in their first few years but then usually adjust to higher interest payments. It is estimated that around $1 trillion in adjustable-rate mortgages are due to reset over the next 2 years at much higher interest rates.

A study by the Center for Responsible Lending predicts that 20% of subprime mortgages made over the last 2 years, equivalent to 5% of total mortgages originated could go into foreclosure. This new supply of foreclosed homes dumped on the market would easily push down prices and curtail home building.

Moreover, there is increasing pressure on Capitol Hill to enact legislation sponsored by Barney Frank, the new chairman of the House of Financial Services Committee, designed to tighten up lending standards and disclosure rules. This could shut out 25% of potential subprime buyers from obtaining mortgages according to Merrill Lynch.

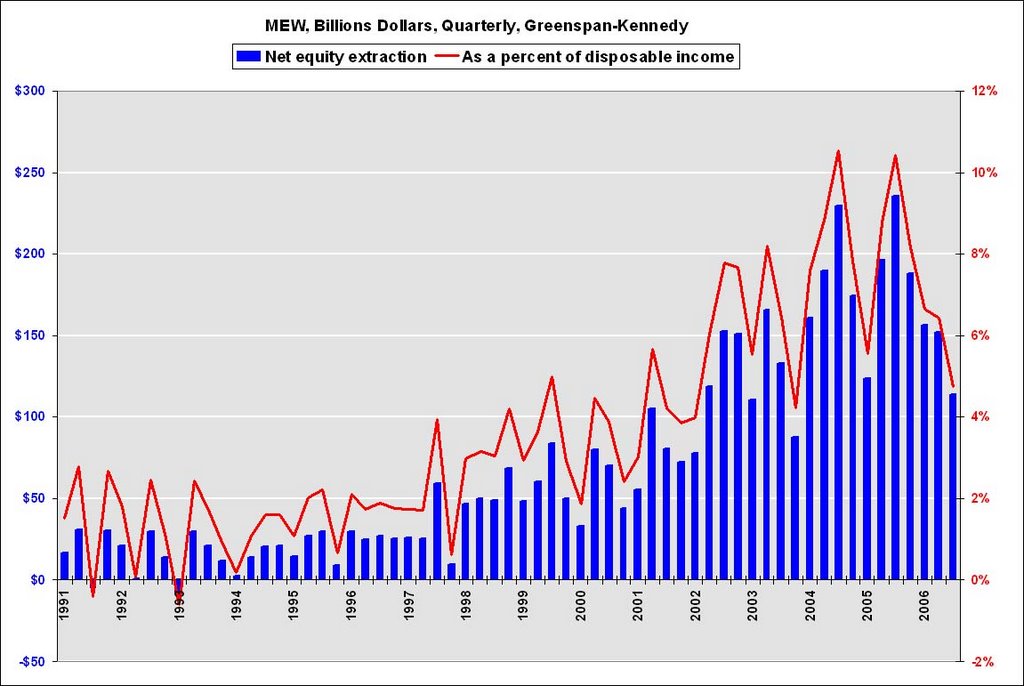
It is hard to imagine mortgage equity withdrawals (MEWs) continuing at the same pace as in recent years. Given that MEWs were a major source of household liquidity (as this graph by Calculated Risk depicts), consumer spending will have a tough time increasing.

Increasing foreclosures along with tighter lending standards for new borrowers is going to cause this housing downturn to be one of the worst ever, and likely to drag the economy into a recession.

How Much Does Housing Wealth Boost Consumption?

No one will debate whether increasing home prices have had a positive effect on consumer spending. But there is considerable debate on how significant this effect is. I am in the camp that believes that the housing boom was the main contributor to consumer spending since 2001.

Last week’s Economist highlights a new study that estimates that each dollar increase in house prices eventually boosts consumer spending by 9 cents rather than 3 to 5 cents as widely thought. This implies that a loss of $1 trillion in housing wealth — which is how much housing wealth increased annually in recent years — would cause consumption to decline by $90 billion or three-quarters of a percentage point from GDP.

hew_income

In addition, as the housing slump worsens we can expect massive unemployment to hit construction workers, real estate agents, mortgage brokers, etc. This will lead to a substantial loss of income and consumption which should cause GDP to fall by much more than three quarters of a percent.

The Coming Bear: Severe Recession (Part 3)

I will build on my conclusions from the first two parts of this series to analyze where the economy is headed. In the first part I discussed why interest rates are heading higher. As a consequence, in the second part of this series I argued that the housing market will experience falling prices. If my predictions turn out to be correct, the economy will suffer a recession that would be even more painful than that of 2001.

What Recession?

The 2001 recession was relatively short and mild compared to those in the past. As the economy contracted, President Bush provided stimulus by introducing legislation that cut taxes while simultaneously increasing spending on social programs and defense.

The economy also received a boost when the Federal Reserve rushed to cut rates to an unprecedented level of 1%. At the same time China entered the WTO and U.S.-China trade exploded. Since China wanted to maintain the yuan’s peg to the dollar, they were forced to use their surplus dollars to buy U.S. investments, in particular bonds which caused both short and long-term rates to fall.

Historically low rates spurred consumers to take on record debt which was used to buy things like plasma TV’s, SUV’s, stocks, and especially houses. As the demand for housing outstripped supply, prices started to rise at an unusually high rate. When the value of peoples homes increased it caused their wealth to also increase even though their wages saw no improvement during the same period. This wealth effect contributed to further consumption and home equity extraction.

The Housing Effect

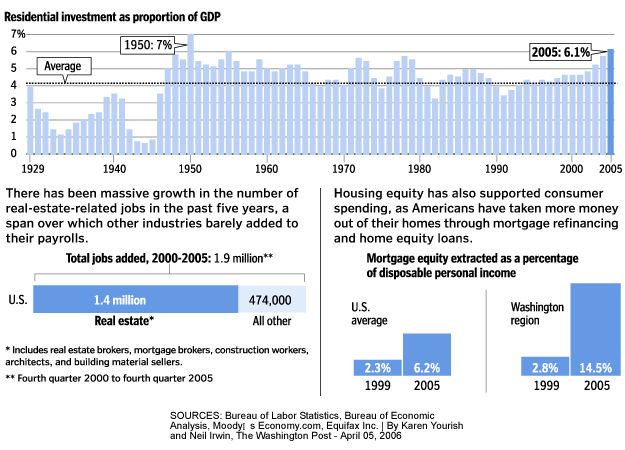
Since 2001, manufacturing has been replaced by housing as the main engine for economic growth. As the following graphic shows, the booming housing market’s impact on the economy cannot be overstated.

housing_impact_economy

However, as I concluded in the previous part of this series housing is overvalued and prices will decline over the coming few years. Such a scenario would devastate the economy. Dean Baker estimates that a contraction in housing activity could shave 3 to 4 percent off GDP.

Housing construction is equal to approximately 5 percent of GDP. Construction of new homes has been going on at a near-record pace over the last few years, in response to the run-up in housing prices. Home construction could easily fall back 40 percent (this was the drop off in the 1981-82 recession), which would imply a direct loss in demand equal to 2 percentage points of GDP.

In addition, the large wealth effect associated with the housing bubble, which has spurred a consumption boom in the last few years, will go into reverse as housing prices plummet. Research from the Federal Reserve Board shows that a dollar in additional housing wealth leads to 4 to 6 cents of annual consumption. This implies that a loss of $5 trillion in housing wealth would lead to a decline in annual consumption of between $200 billion and $300 billion. This loss in consumption is equivalent to 1.6 to 2.5 percentage points of GDP.

Combining the 2 percentage point drop in demand due to a falloff in housing construction with the 1.6 to 2.5 percentage point drop in demand due to the reversal of the housing bubble’s wealth effect leads to a falloff in demand of between 3.6 and 4.5 percentage points of GDP. If employment fell in the same proportion, this would imply the loss of between 5.0 million and 6.3 million jobs.

Since recent data is indicating a hard landing for housing, I am expecting that we will see a recession in 2007. This time Fed rate cuts will not save the economy since foreigners will put upward pressure on long rates. In addition, the government will be handcuffed to provide fiscal stimulus since it is already running unsustainable budget deficits. Therefore, the upcoming recession should be far more painful than the last economic contraction and it could turn out to be as bad as Japan’s recent experience.